Dashboard & KPI Widgets
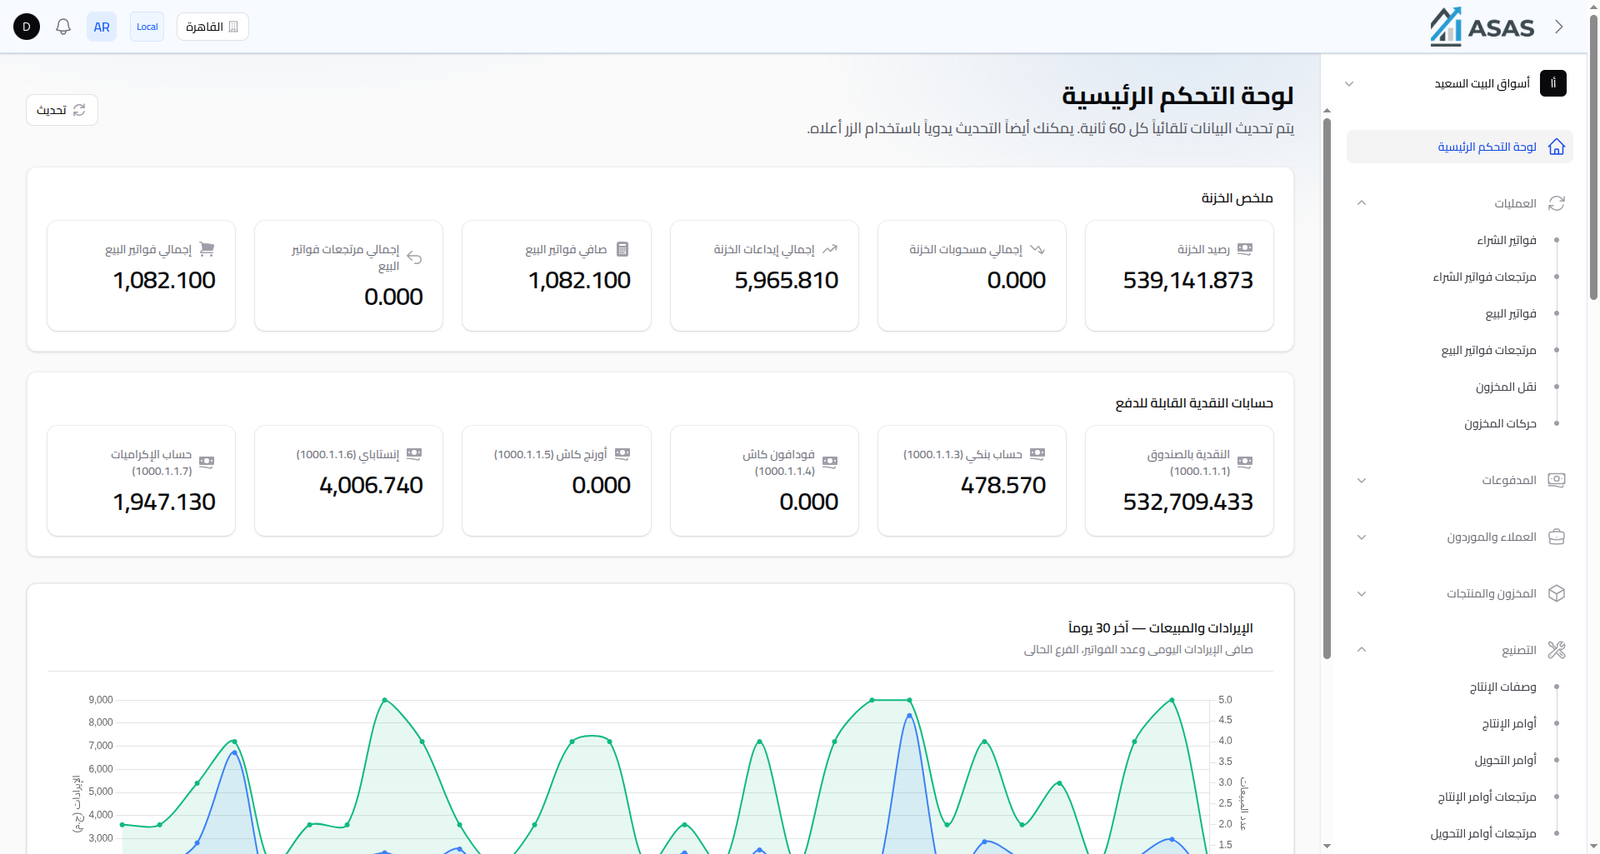
The first page you see when opening a company, refreshing its data automatically every 60 seconds (or manually with the Refresh button).
Components
- Treasury Summary: current treasury balance, total withdrawals and deposits, and net sale invoices (current branch).
- Payable Cash Accounts: the balance of each individual cash/bank/e-wallet account.
- Revenue & Sales — Last 30 Days: a chart of daily net revenue and invoice count.
- Sales by Category — Last 30 Days: top categories by net amount.
- Top 10 Best-Selling Products (by Quantity / by Revenue) — Last 30 Days.
- Top Products in Stock Now, Low Stock Now, Top Selling Products in Stock Now: filterable by warehouse.
- Top Ten Customers by Balance and Top Ten Suppliers by Balance: each with a direct link to that customer's/supplier's account statement.
Notes
- Every figure on the main dashboard is calculated at the current branch level (as set by the branch switcher in the top bar), not the whole company.
- For deeper analysis beyond the last 30 days or the current branch, use the dedicated Reports pages.